


Last updated Nov. 3
As communities across the Untied States grapple with the administration of an uncertain election amid a global pandemic, The S&B broke down the data from Poweshiek County.
States across the country have seen an unprecedented uptick in the number of absentee ballots cast by mail in 2020. In Iowa, every registered voter was sent an application for an absentee ballot to reduce the risk of COVID-19 transmissions at the polls on election day and during early voting. The following chart shows the number of absentee ballots received by Poweshiek County officials over time, according to data from the Iowa Secretary of State. By comparison, the total number of votes cast in the 2016 election was 9,916, 4,708 of which were absentee. In Iowa, only absentee ballots postmarked by Nov. 2 and received by the county auditor no later than noon on Nov. 9 can be counted.
Total ballots received: 6,369
Absentee ballots outstanding: 279
Absentee Ballots Received in Poweshiek County
Though voters registered with one party do not always vote for the candidate of that party, Democrats have dominated absentee voting in Poweshiek County and across the nation. The charts below show the percentage of received absentee ballots cast by voters of each party registration. Poweshiek County and Iowa data are provided by the Iowa Secretary of State, national data were compiled by Michael McDonald of the University of Florida at the U.S. Elections Project.
Absentee Ballots Received by Party Registration
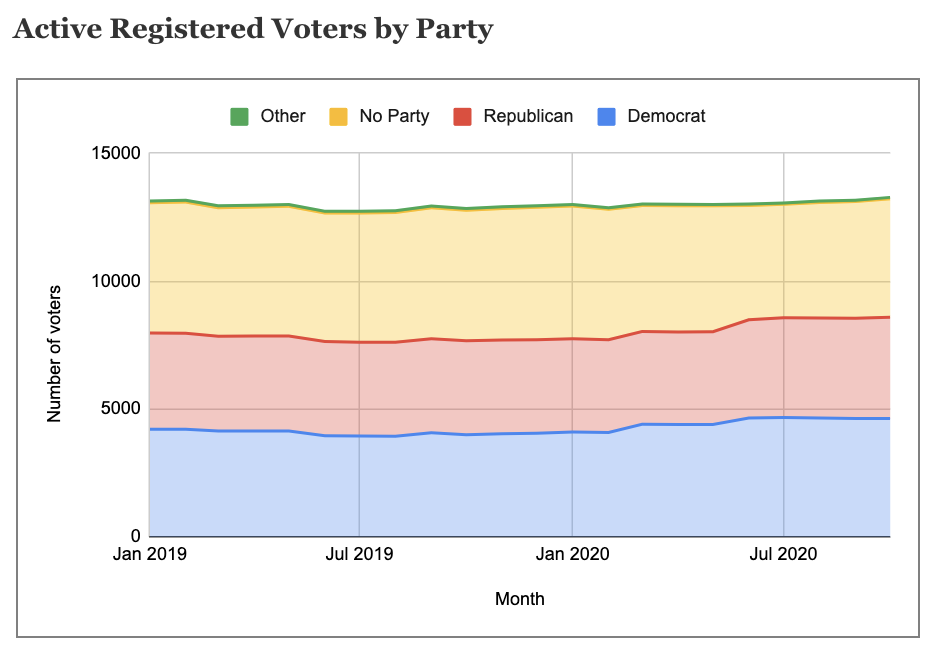
Political parties often point to the number of registered voters as an indicator of success as well. The following chart, based on Iowa Secretary of State data, shows the number of voters registered with each party from the beginning of 2019.
Active Registered Voters by Party
Turnout is predicted to be high, even record-breaking, across the United States as voters choose between two opposing presidential candidates, decide control of the United States Senate and House of Representatives, and elect local representatives. Since 2000 in Poweshiek County, the number of registered voters has marginally increased while turnout has remained consistent, following the national trend of higher turnout in the years of presidential elections and lower turnout for midterm elections. The data in the following chart are from the Iowa Secretary of State.